Make a mesh with MeshMaker#
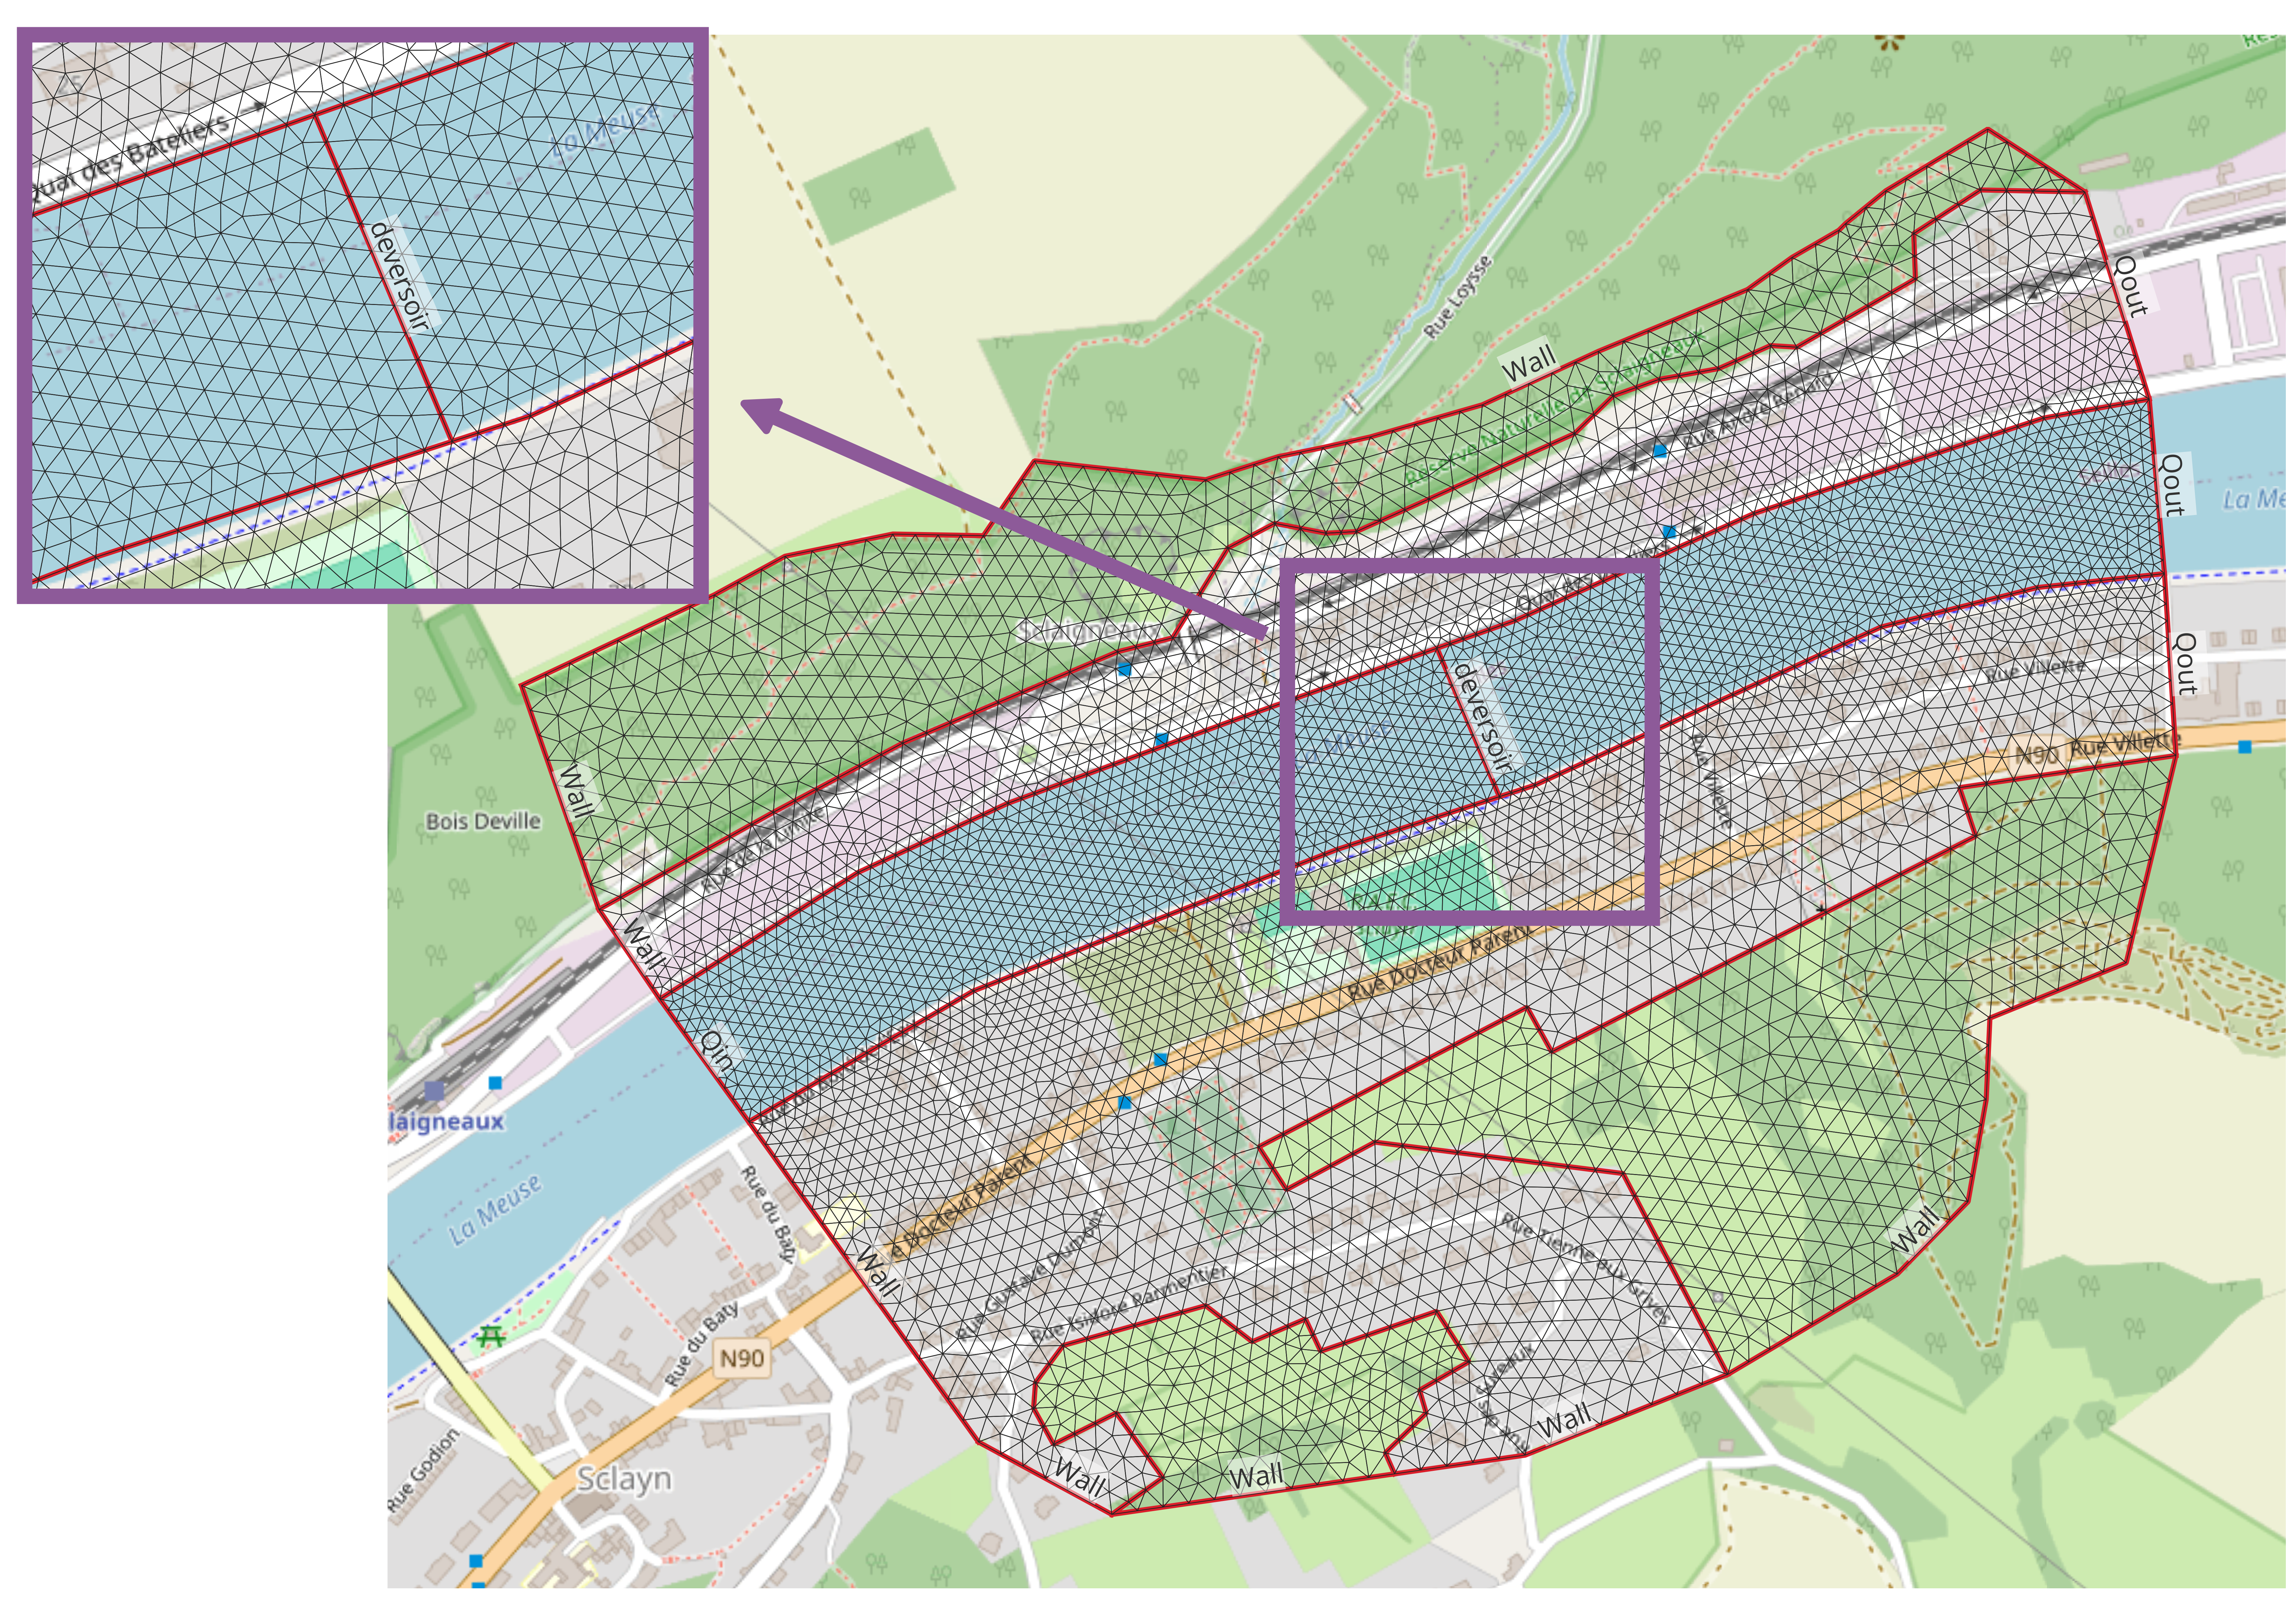
This tutorial guides you through the process of creating a mesh for a field-based hydraulic study using QGIS and the MeshMaker class from Watlab.
Step 1: Shapefile in QGIS#
To begin, make sure QGIS is installed and that you have a clear understanding of your zones, boundaries, and regions. You’ll first create a shapefile (.shp) that represents the structure of your mesh.
Create the file .shp#
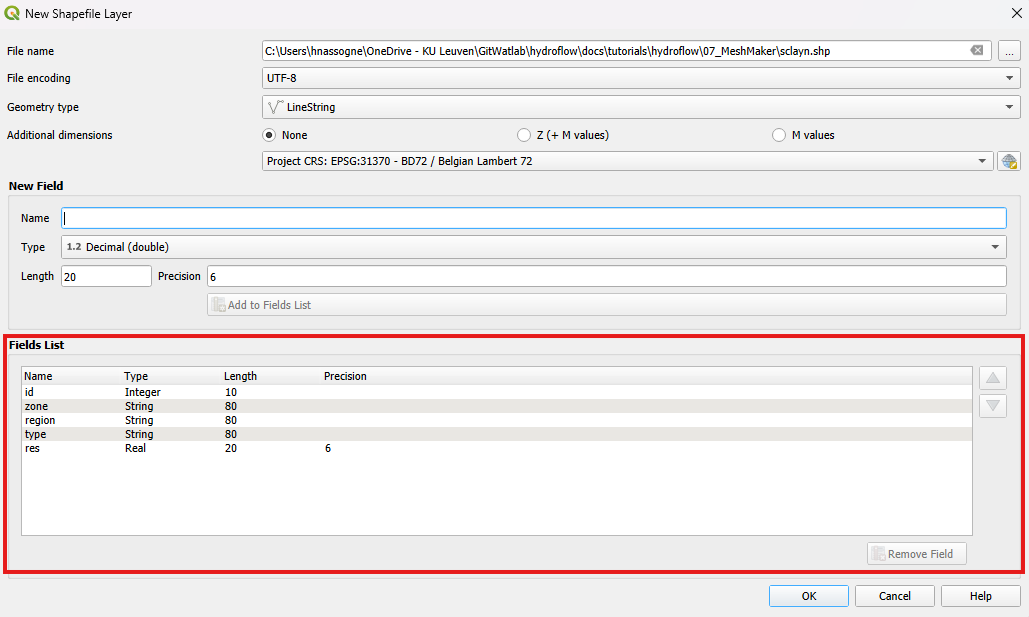
In QGIS, go to Layer → Create Layer → New Shapefile Layer and follow these steps:
Choose a clear and consistent file name, and save the layer in your working folder.
Geometry type: LineString
Coordinate Reference System (CRS):
Lambert 72(EPSG:31370)Add the following attributes (by adding
New Field). Be careful to use these exact names (lowercase, no extra spaces or capital letters):
Name |
Type |
|---|---|
|
Text |
|
Text |
|
Text |
|
Decimal |
“Draw” the shapefile#
Use the editing tools (yellow pencil icon) to draw segments. Right‑click when you want to assign attributes. The idea is to draw lines around each zone, but the meaning of the attributes depends on the role of the line:
zoneIf the line connects two different zones and participates in the closure of both, list them separated by a semicolon:
"Foret 1 ; Ville 1".If the line is internal to a single zone (e.g., representing a weir, where you would apply a discharge or water level), then the
zonefield must remain empty (NULL by default in QGIS).If the line does not serve to close a zone (for example, an island within a river that does not close the river zone), then you only need to specify the zone name of the island in the attribute field.
regionA region is a group of zones (e.g., several forest zones grouped under
"Foret").If the line connects two different regions and participates in the closure of both, list them separated by a semicolon:
"Foret ; Ville".If the line is internal to a zone (like a weir), the
regionfield is left empty (NULL by default in QGIS).If the line does not serve to close a region (for example, an island within a river that does not close the river region), then you only need to specify the region of the island in the attribute field.
typeMandatory for boundaries where you want to apply conditions (e.g.,
"deversoir"for a weir,"Qin"for an imposed discharge,"Qout"at the end of the zone).Leave empty if the line is simply a mesh boundary without specific hydraulic meaning.
resDefines the mesh resolution near the line. For example, near riverbanks you may want a finer resolution than at the outer mesh boundary.
type attribute is defined (boundaries where conditions such as inflow or wate)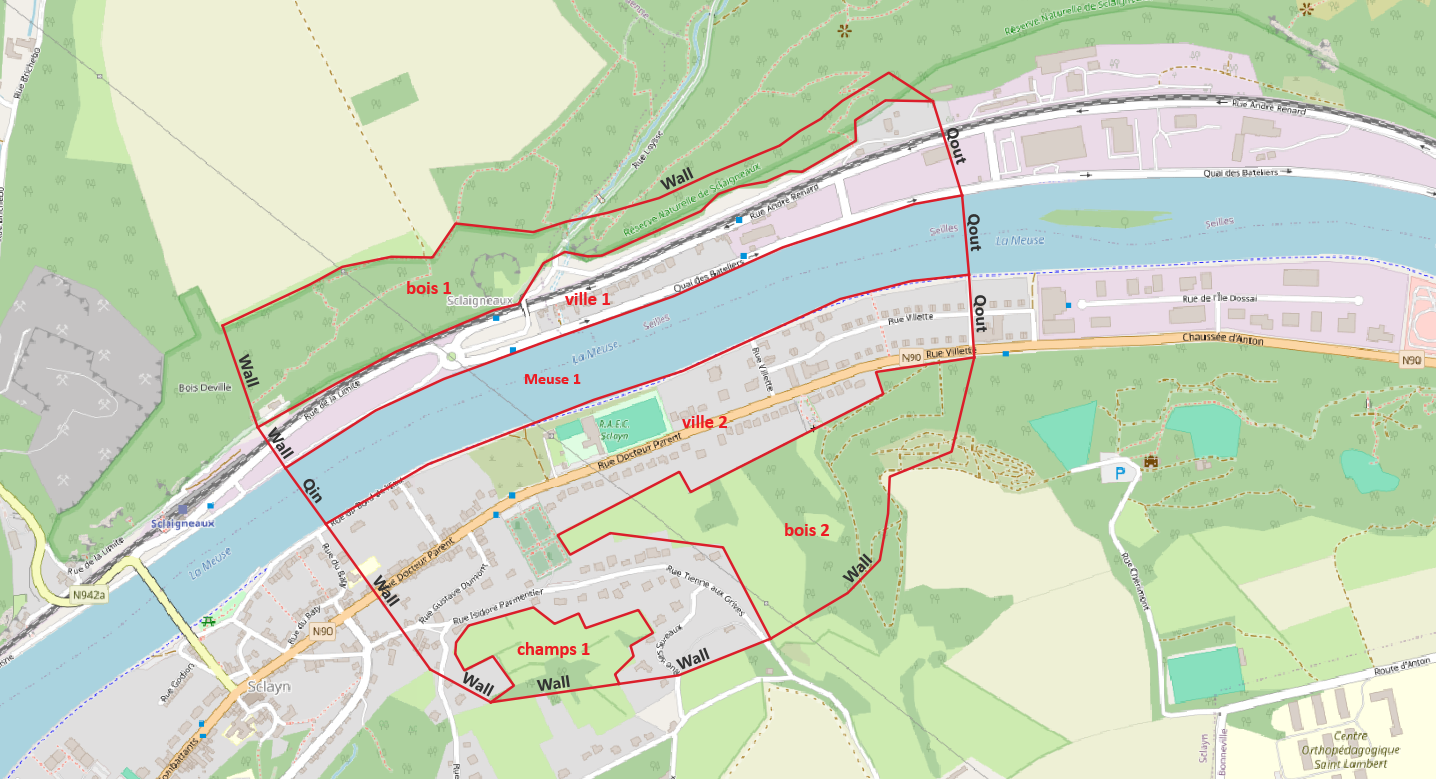
Example shapefile with zones
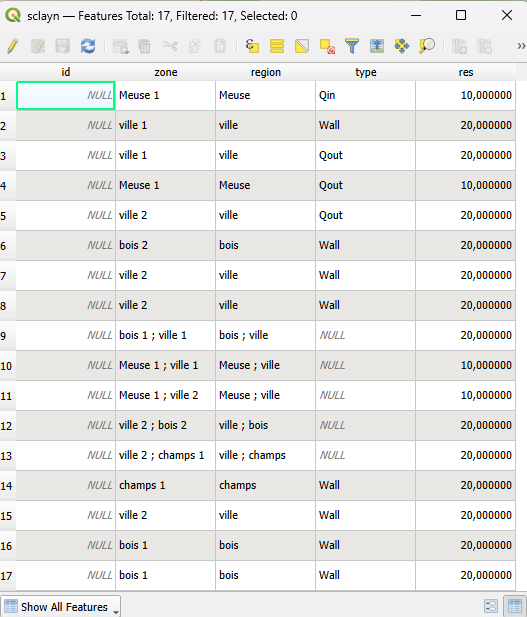
Correctly structured attribute table
The illustration below shows an example of an internal line (here a weir) and the associated attributes:
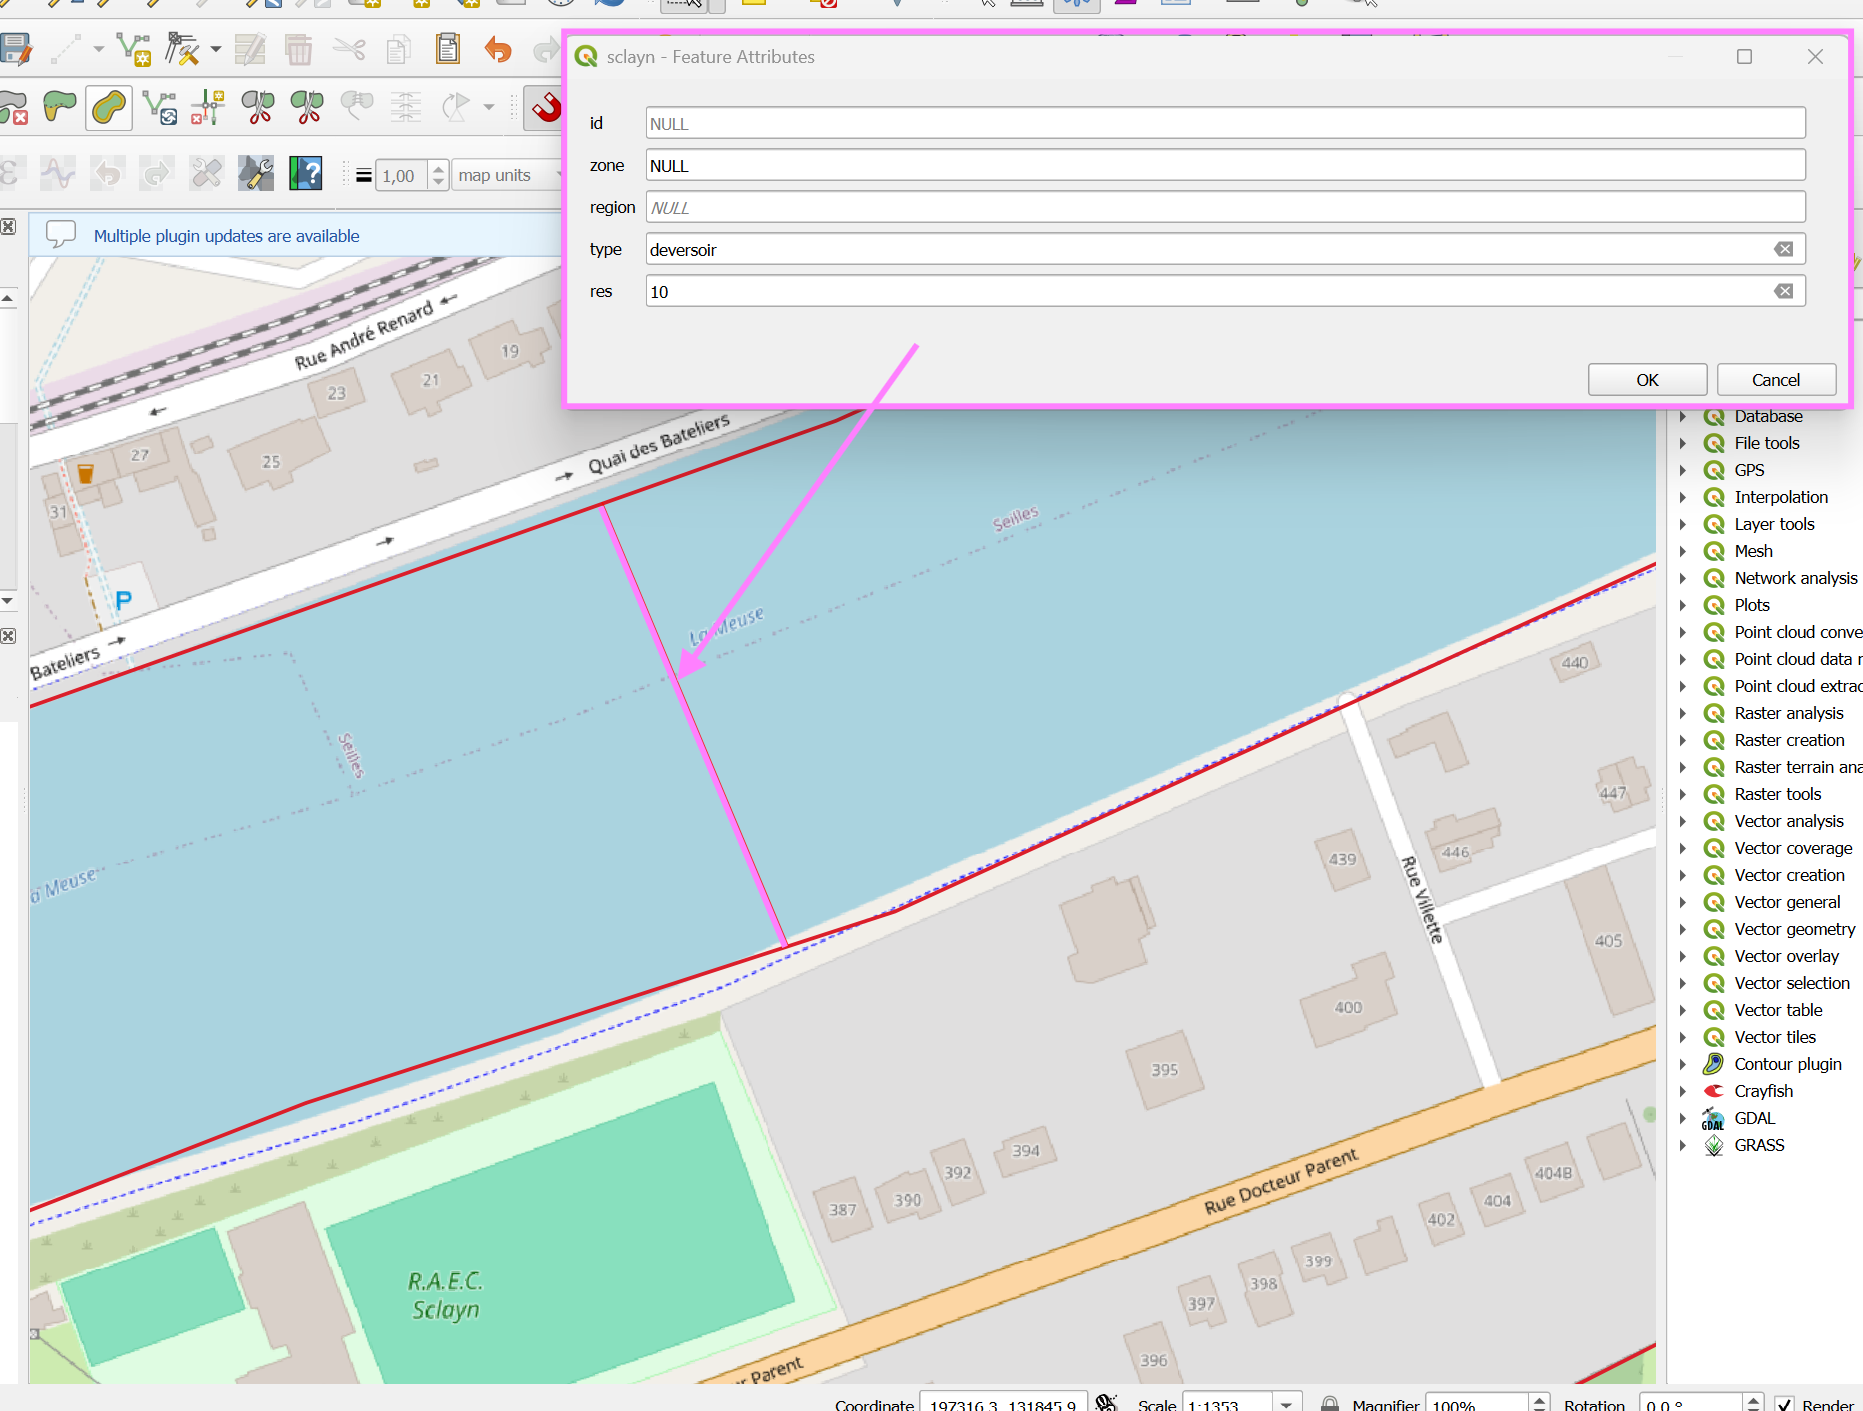
Example of an internal boundary (weir) with attributes
The illustration below shows a line inside a river (forming a small island) and the associated attribute table:
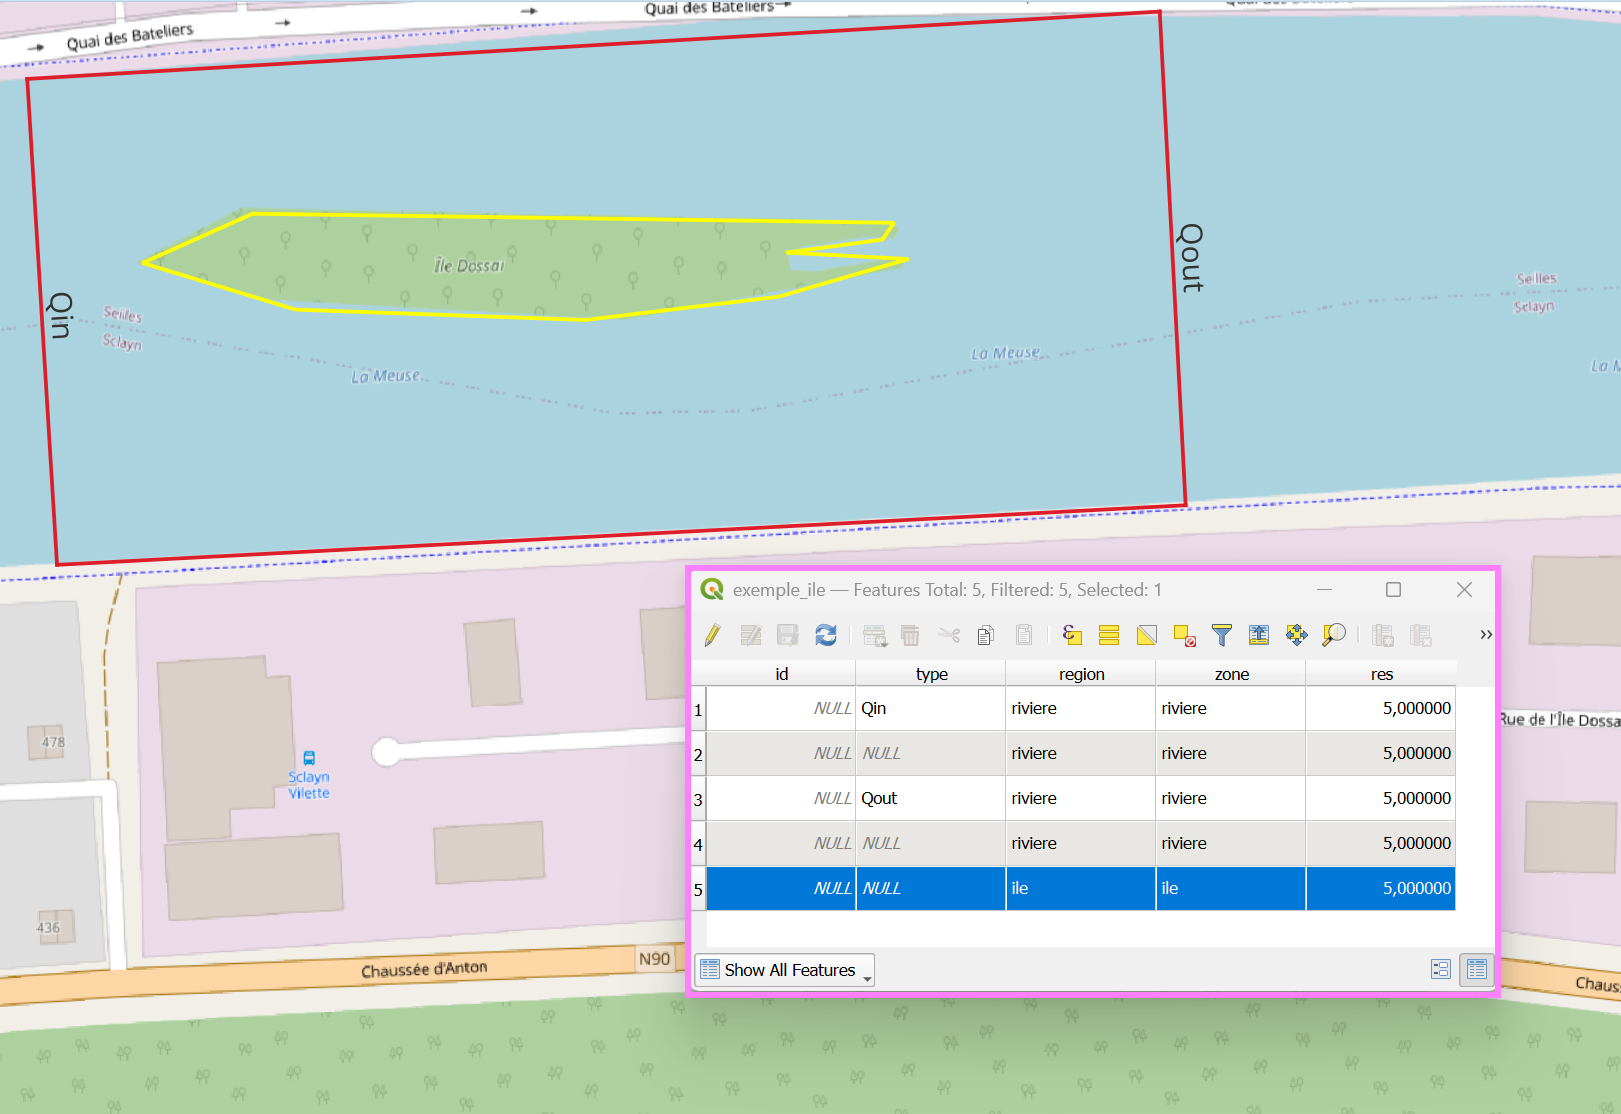
Example of an island boundary with attribute table
🚨 Ensure all attributes are correctly filled in. Even a small typo or missing value can prevent the mesh from generating properly. Always double-check your attribute table.
Save the .shp file#
Once your edits are complete, save the layer. In your chosen folder, you’ll find the main .shp file along with accompanying files (.dbf, .shx, .prj, etc.). Keep them together, they’re all needed for mesh generation.
Step 2: Load the shapefile and generate the mesh#
Now it’s time to create the mesh using the geometry and attributes you defined in your shapefile. To do this, use the MeshMaker class from Watlab and provide the filename of your shapefile, then, use the make_mesh() function to generate the mesh. You can print the detected zones and regions to check if everything was correctly identified.
💡 The ``MeshMaker`` class includes other useful functions, feel free to explore them!
If you want to visualize the mesh directly while the code is running, set display_ui=True when calling make_mesh.
[ ]:
import watlab

filename = "sclayn.shp"
meshMaker = watlab.utils.MeshMaker(filename, type = "shp")

# Optional: check detected zones and regions
print("Zones:", list(meshMaker.data.zones.keys()))
print("Regions:", list(meshMaker.data.regions.keys()))

# Generate the mesh
mesh_name = "mesh_sclayn.msh"
meshMaker.make_mesh(mesh_name, display_ui=False)
Zones: ['bois 2', 'ville 2', 'bois 1', 'ville 1', 'champs 1', 'Meuse 1']
Regions: ['ville', 'champs', 'bois', 'Meuse']
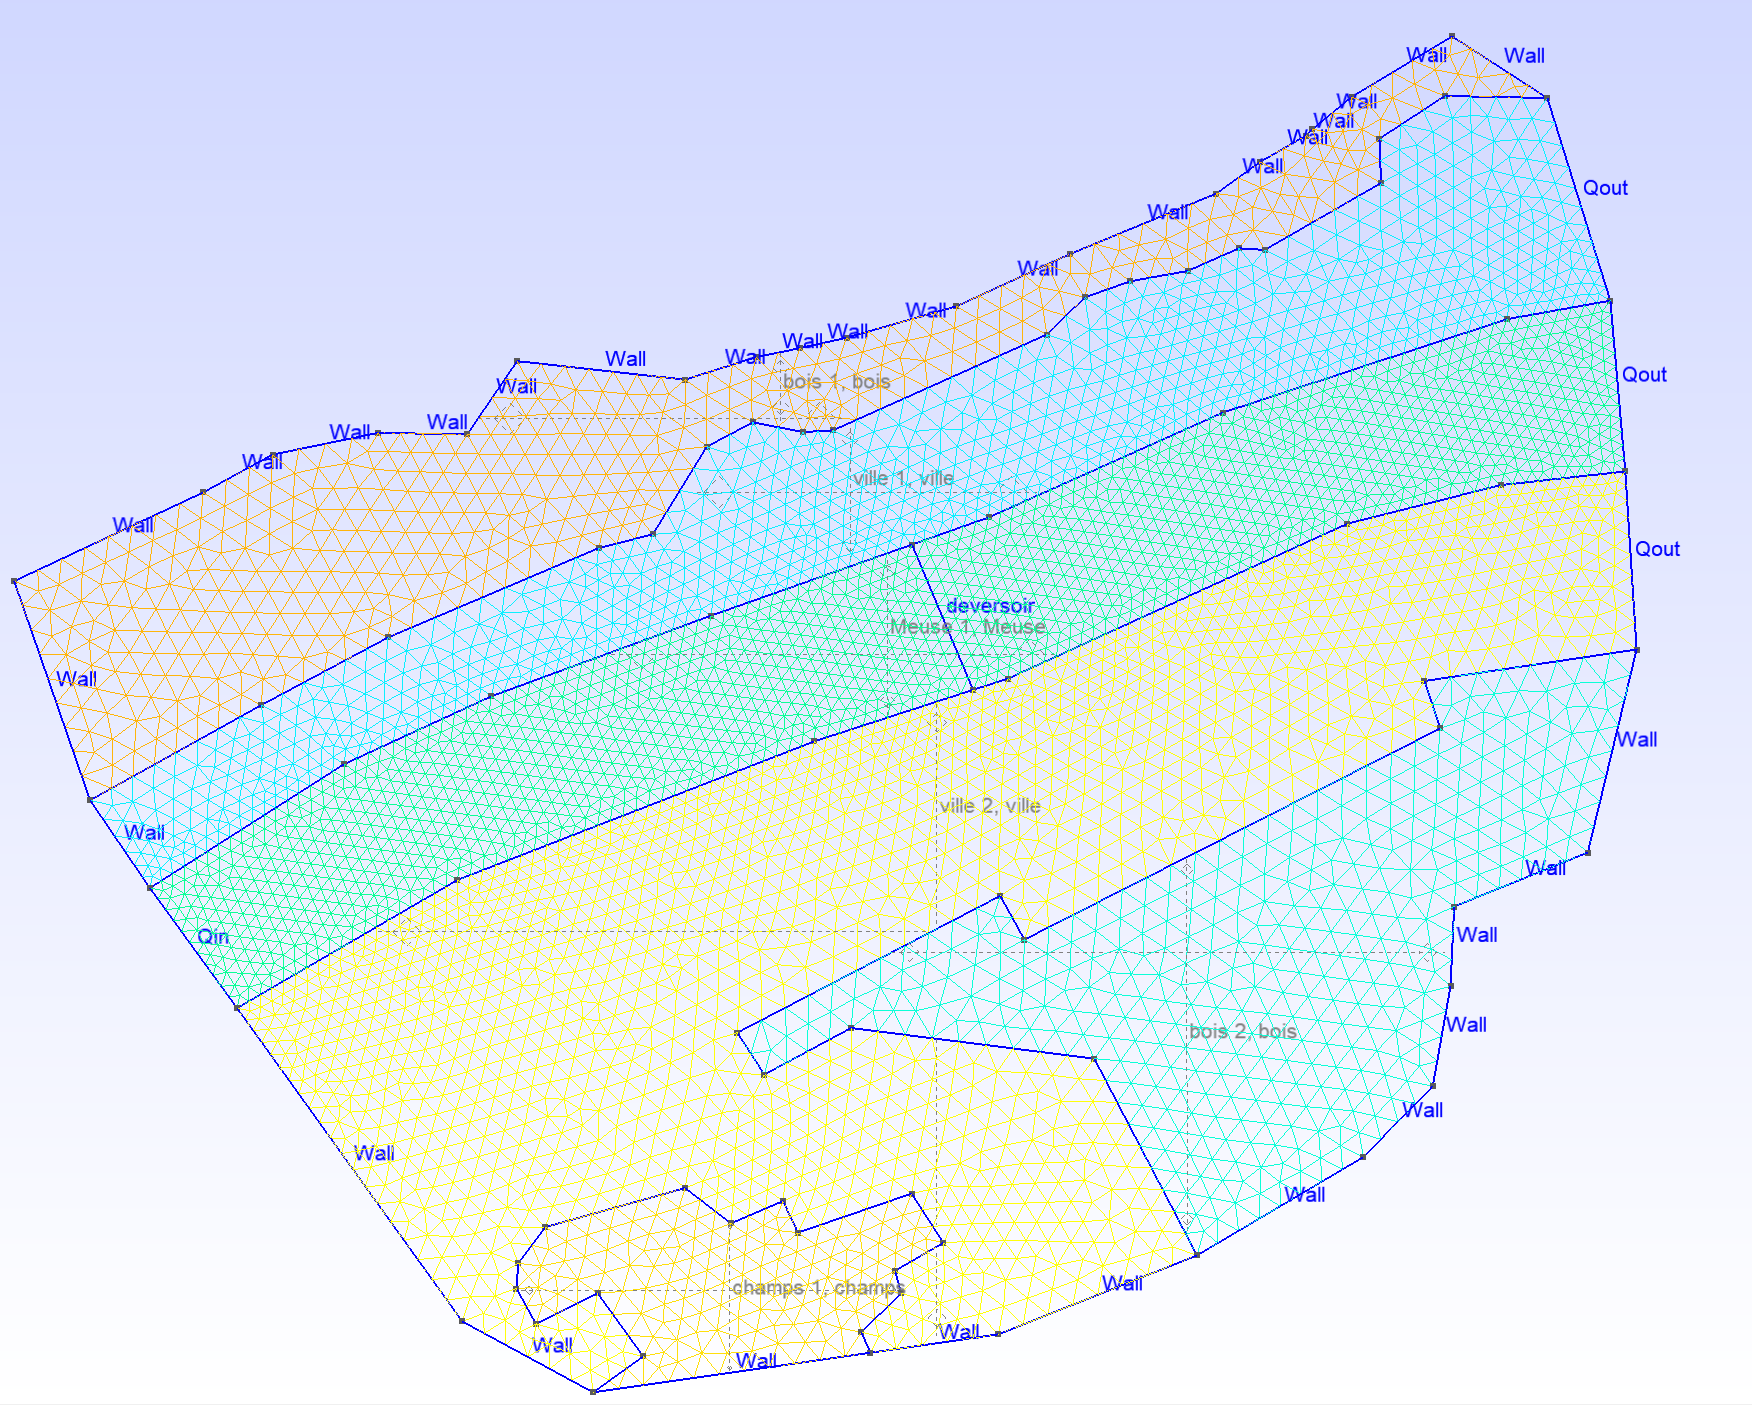
Optionnal: Convert the mesh file to open it in QGIS#
The mesh file will be used in your Watlab model, but if you want to visualize it in QGIS, you need to convert it into a GeoPackage (.gpkg) file. This conversion can be done using Gmsh.
[9]:
import seamsh.gmsh
import seamsh.geometry
from osgeo import osr

domain_srs = osr.SpatialReference()
domain_srs.ImportFromEPSG(31370)

domain = seamsh.geometry.Domain(domain_srs)

output_srs = osr.SpatialReference()
output_srs.ImportFromEPSG(31370)


seamsh.gmsh.convert_to_gis("mesh_Sclayn.msh", output_srs, "mesh_Sclayn.gpkg")
* Convert "mesh_Sclayn.msh" into "mesh_Sclayn.gpkg" *