Remesh and restart#
This jupyter notebook explains how to use the restart simulation tool implemented in hydroflow. Now make sure you have installed Watlab correctly, and dig in with us!
Generate the meshes:#
In this example, you need to run Mesh_fine.py and Mesh_coase.py to generate the two meshes. One mesh is coarser and was used in a previous simulation and the simulation is restarted on the finer mesh.
Watlab helps you master the model#
Now that the geometry of your domain is done, you can focus on solving your hydraulic problem. For this, you need a solver (hopefully, Watlab provides you one!). You also need to tell Watlab what mesh represents the domain, and what conditions are set to the cells and the boundaries.
The example here is only hydrodynamics, so the solver is hydroflow.
In this example, we use a the HydroFlow’s API to model another case. It consists in restarting a dam break simulation on a finer mesh.
First, import Watlab, import the mesh, and create a Watlab model!
[1]:
import watlab

mesh = watlab.Mesh("damBreak_fineMesh.msh")
model = watlab.HydroflowModel(mesh)
Several properties can be given to the model (see the documentation for a complete set of properties).
[2]:
model.name = "Restart_Simulation"
model.ending_time = 5
model.Cfl_number = 0.95
Here, you only need to apply specific friction coefficients. Initial water level and velocity are remapped from the previous results. Boundaries conditions need to be explicitely specified.
[3]:
model.set_friction_coefficient("Filled area",0.01)
model.set_friction_coefficient("Empty area",0.01)

model.set_wall_boundaries(["Boundaries down","Boundaries up","Boundaries left","Boundaries right"])
Provide the number of required results files:
[4]:
model.set_picture_times(n_pic = 6)
Finally, decide to resume to a previous simulation state recorded in the output_coarse folder
[5]:
model.resume_simulation("pic_coarse_hotstart.txt", isSameMesh = False, isParallel=True)
Input Files Generated
hydroflow.exe exists
Launching the executable ...
Total execution time: 22 sec. for 5 sec. of simulation.
Visualize the results with the Plotter class combined with matplotlib#
[6]:
import matplotlib.pyplot as plt

#create the mesh and plotter object
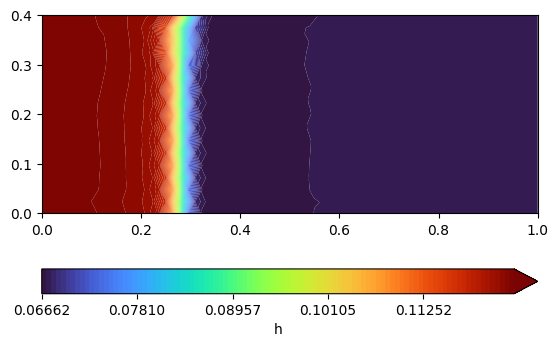
coarse_mesh = watlab.Mesh("damBreak_coarseMesh.msh")
coarse_plotter = watlab.Plotter(coarse_mesh)

#time of the plot
myPic1 = "pic_coarse_hotstart.txt"
coarse_plotter.plot(myPic1, "h")
plt.show()

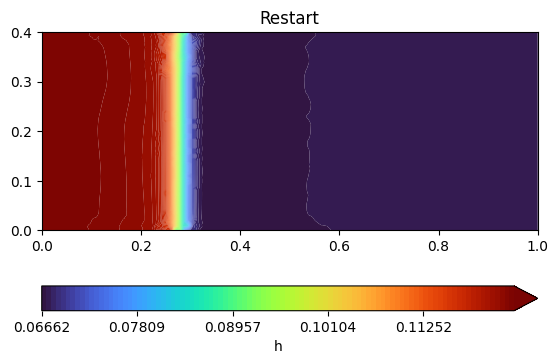
plotter = watlab.Plotter(mesh)
#time of the plot
time1 = "0_00"
myPic1 = "output\\pic_"+ time1 +".txt"
plotter.plot(myPic1, "h")
plt.title("Restart")
plt.show()

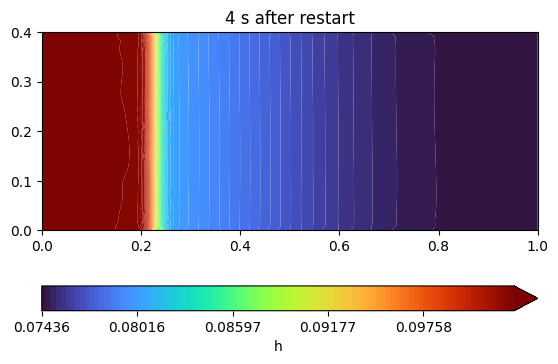
time2 = "4_00"
myPic2 = "output\\pic_"+ time2 +".txt"
plotter.plot(myPic2, "h")
plt.title("4 s after restart")
plt.show()


[ ]: