Next: Results Up: Pilot study Previous: Hypotheses
For this reason, we chose to conduct exclusively non parametric tests in order to investigate the aforementioned hypotheses. One-sample Wilcoxon signed-rank test, Match-paired Wilcoxon signed-rank test and Friedman's 2-way ANOVA by ranks were performed. Results of those 3 tests are respectively presented in the following tables only for the balance metric for the sake of conciseness and reading simplicity. You can find all results in the appendix section of the HTML document.
In the unpaired One-sample Wilcoxon test, each metric for each UI is compared to the median of users scores. If the Significance is inferior to 5%, the meaning is that the null hypothesis is rejected and we cannot consider that values are similar. For instance, only the users perceptions of the balance for interface BELGIUM are validating the metric. We proceeded similarly for analyzing the remaining metrics.
In the Matched-paired Wilcoxon test, we compare each variable by pairs and test the null hypothesis according to which the difference of the medians is equal to 0. By analyzing the results provided, we note that balance property of interface ATM gets the lowest scores (negative statistic and Sig. < 0.05) in comparison with the 3 other interfaces.
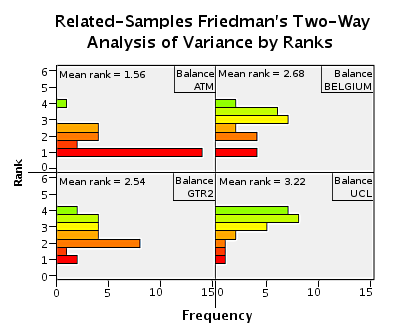
The Friedman ANOVA test could have been discarded because it does not cover directly our hypotheses. However, it is another evidence showing that the users scores for each metric are different when they are compared together. We chose not to add a table just for showing significance of this test which is equal to 0.000 which induces a rejection of the null hypothesis according to which all medians are equal (< 0.05). However, we found the resulting graph comparing each rank relevant for showing dispersion of responses and for supporting the ranking established with the Wilcoxon test.
Zen 2014-05-07
![\begin{table}
\footnotesize
\centering
\begin{tabularx}{\linewidth}{\vert X...
...244 &25 &0.000 &0.895 &25 &0.014&\\ [1ex]
\hline
\end{tabularx}
\end{table}](img1.png)
![\begin{table}
\footnotesize
\centering
\begin{tabularx}{\linewidth}{\vert X...
...e
BalanceUCL &4 &4.08 &= &0.008&\\ [1ex]
\hline
\end{tabularx}
\end{table}](img2.png)
![\begin{table}
\footnotesize
\centering
\begin{tabularx}{\linewidth}{\vert X...
... - BalanceUCL = 0 &-2.083 &0.037&\\ [1ex]
\hline
\end{tabularx}
\end{table}](img3.png)