Each participant was given a questionnaire to fill, a document explaining the metrics and a representation of the four interfaces printed on paper.
The questionnaire contained thirteen sections, one for each metric, and four subsections, one for each interface. For each metric and for each interface, the participants had to give a score on a 5-points Likert scale. A value of 1 meaning that the score given for the considered aesthetic property was low up to a value of 5 considered as an high score for the aesthetic property.
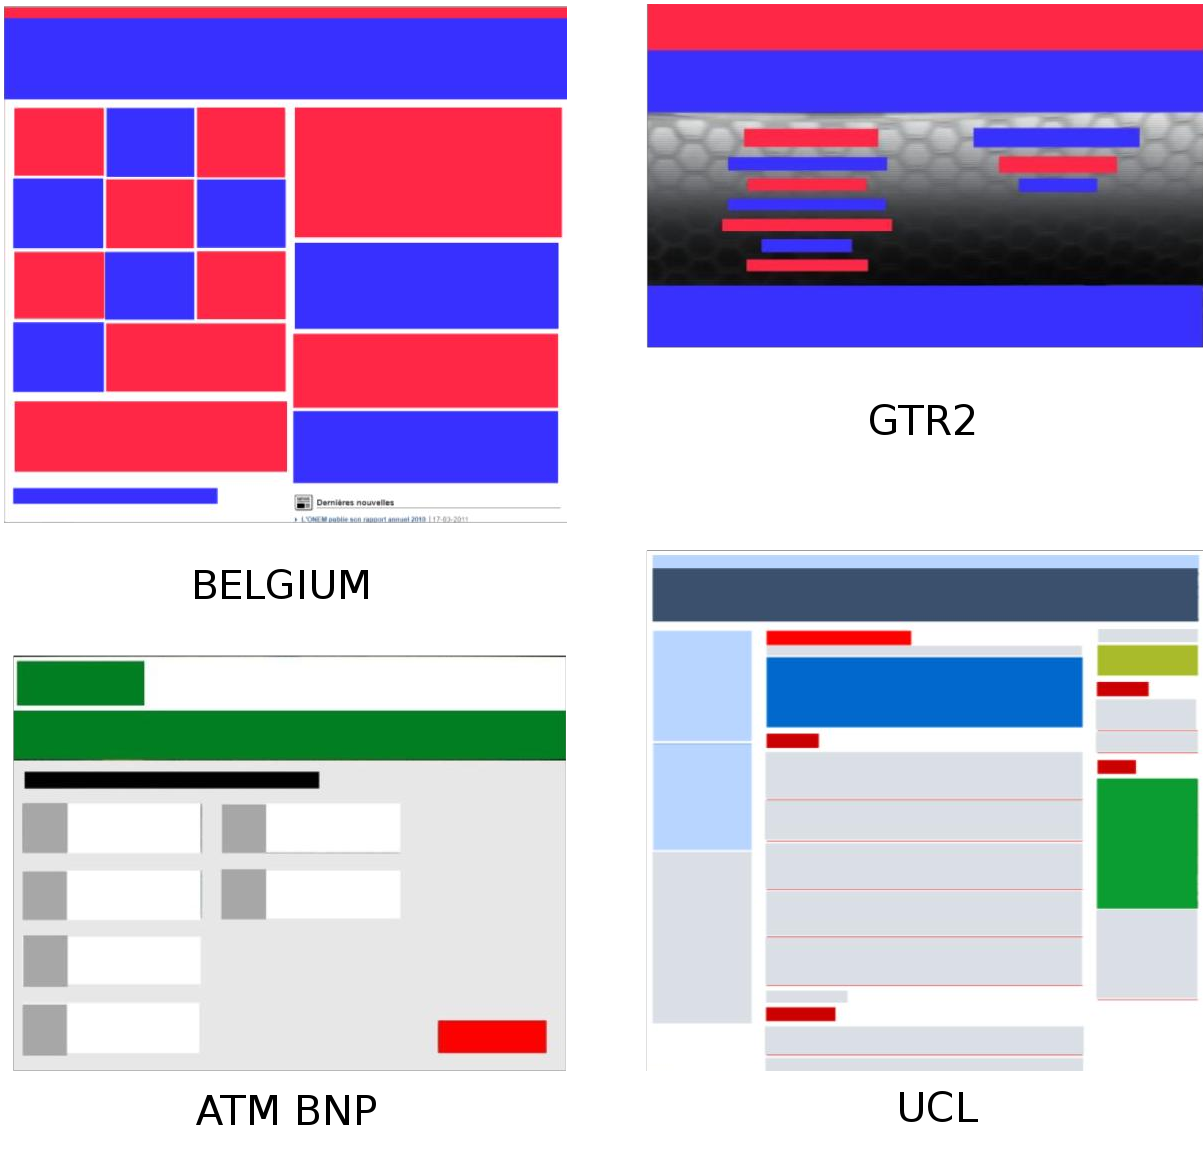
Interviewers provided an explanation for each visual technique as well as two illustrations, each of an interface with high and low values for the metric. The UIs were printed in color on a single recto-verso sheet of A4 paper. Two UIs per page, each with the same size.
Each UI was transformed through a grid definition process. The only purpose of which was to distinguish the interface
objects composing each UI in order to apply the metric analysis.
Figure:
Grid transformation of each selected UI
|
 |
Zen
2014-05-07